


Data Analytics with PowerBI

STARTS ON
- Batch 1: 01 October 2021
- Batch 2: 01 November 2021
DURATION
1 month, 6h LIVE tutoring per week (3 sessions, 2h/session) + 24/7 ONLINE supports
PROGRAMME FEES
3.500.000 VND, with financial aids (*)
(*) Apply before 15 September 2021 and avail an early bird tuition assistance of 15%. Use code ED15PBI while applying.
This programme is especially for whom?
Data Professionals & Managers
Business Managers, Business Analysts and Data Analysts
Students & Graduates
Final year students and graduates who are looking for jobs in Economics, Accounting – Audit – Finance.

K-12 & College students

- Microsoft Power BI, a business analytics solution, allows users to quickly build professional management reporting systems on a variety of complex data sources. Data will be aggregated, pre-processed and visualized, presented throughout the business situation of the business, accompanied by necessary forecasts and predictions to help support important, valuable decisions. strategies at all levels of management.
- Just having basic Excel knowledge, after the course you will understand the data analysis process, data processing operations, create reports with data in a professional way, so that you can apply it effectively. results in real data analysis situations in their work.
Expected results:
After completing the course, students will have the skills:
- Understanding is the process handle, analyze the data material with PowerBI.
- Know how to aggregate and process and synchronize data from many different data sources .
- Understand clearly and know how to use type the map in accordance with to directly view merchandise information data according to love bridge.
- Knowing how the presentation Dashboard a way of pressing subjects, specializing in industrial and communication load is the message.
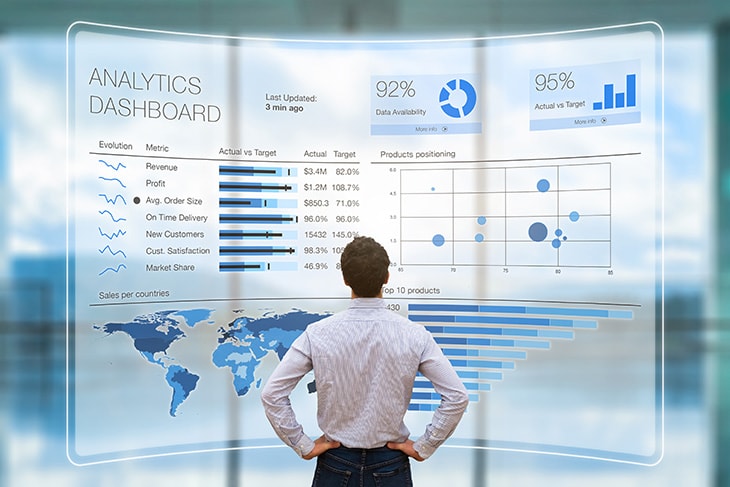
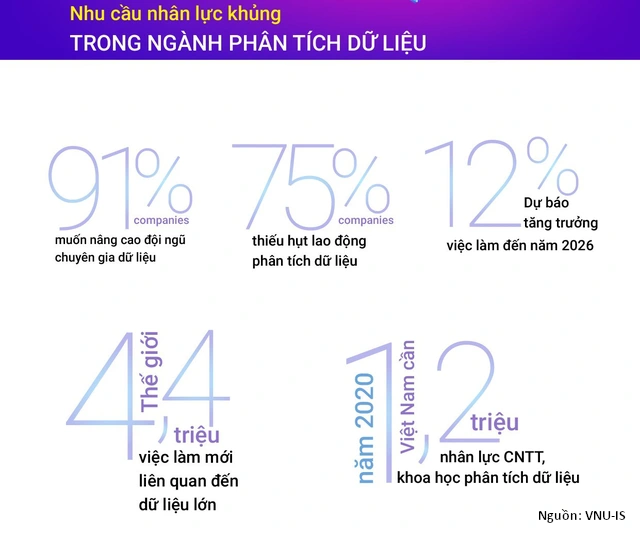
Data Analytics is a hot job
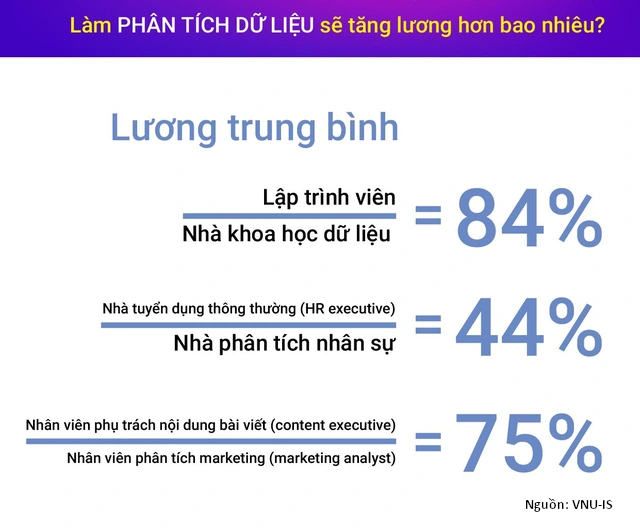
Learn Data Analytics to get high-paying jobs
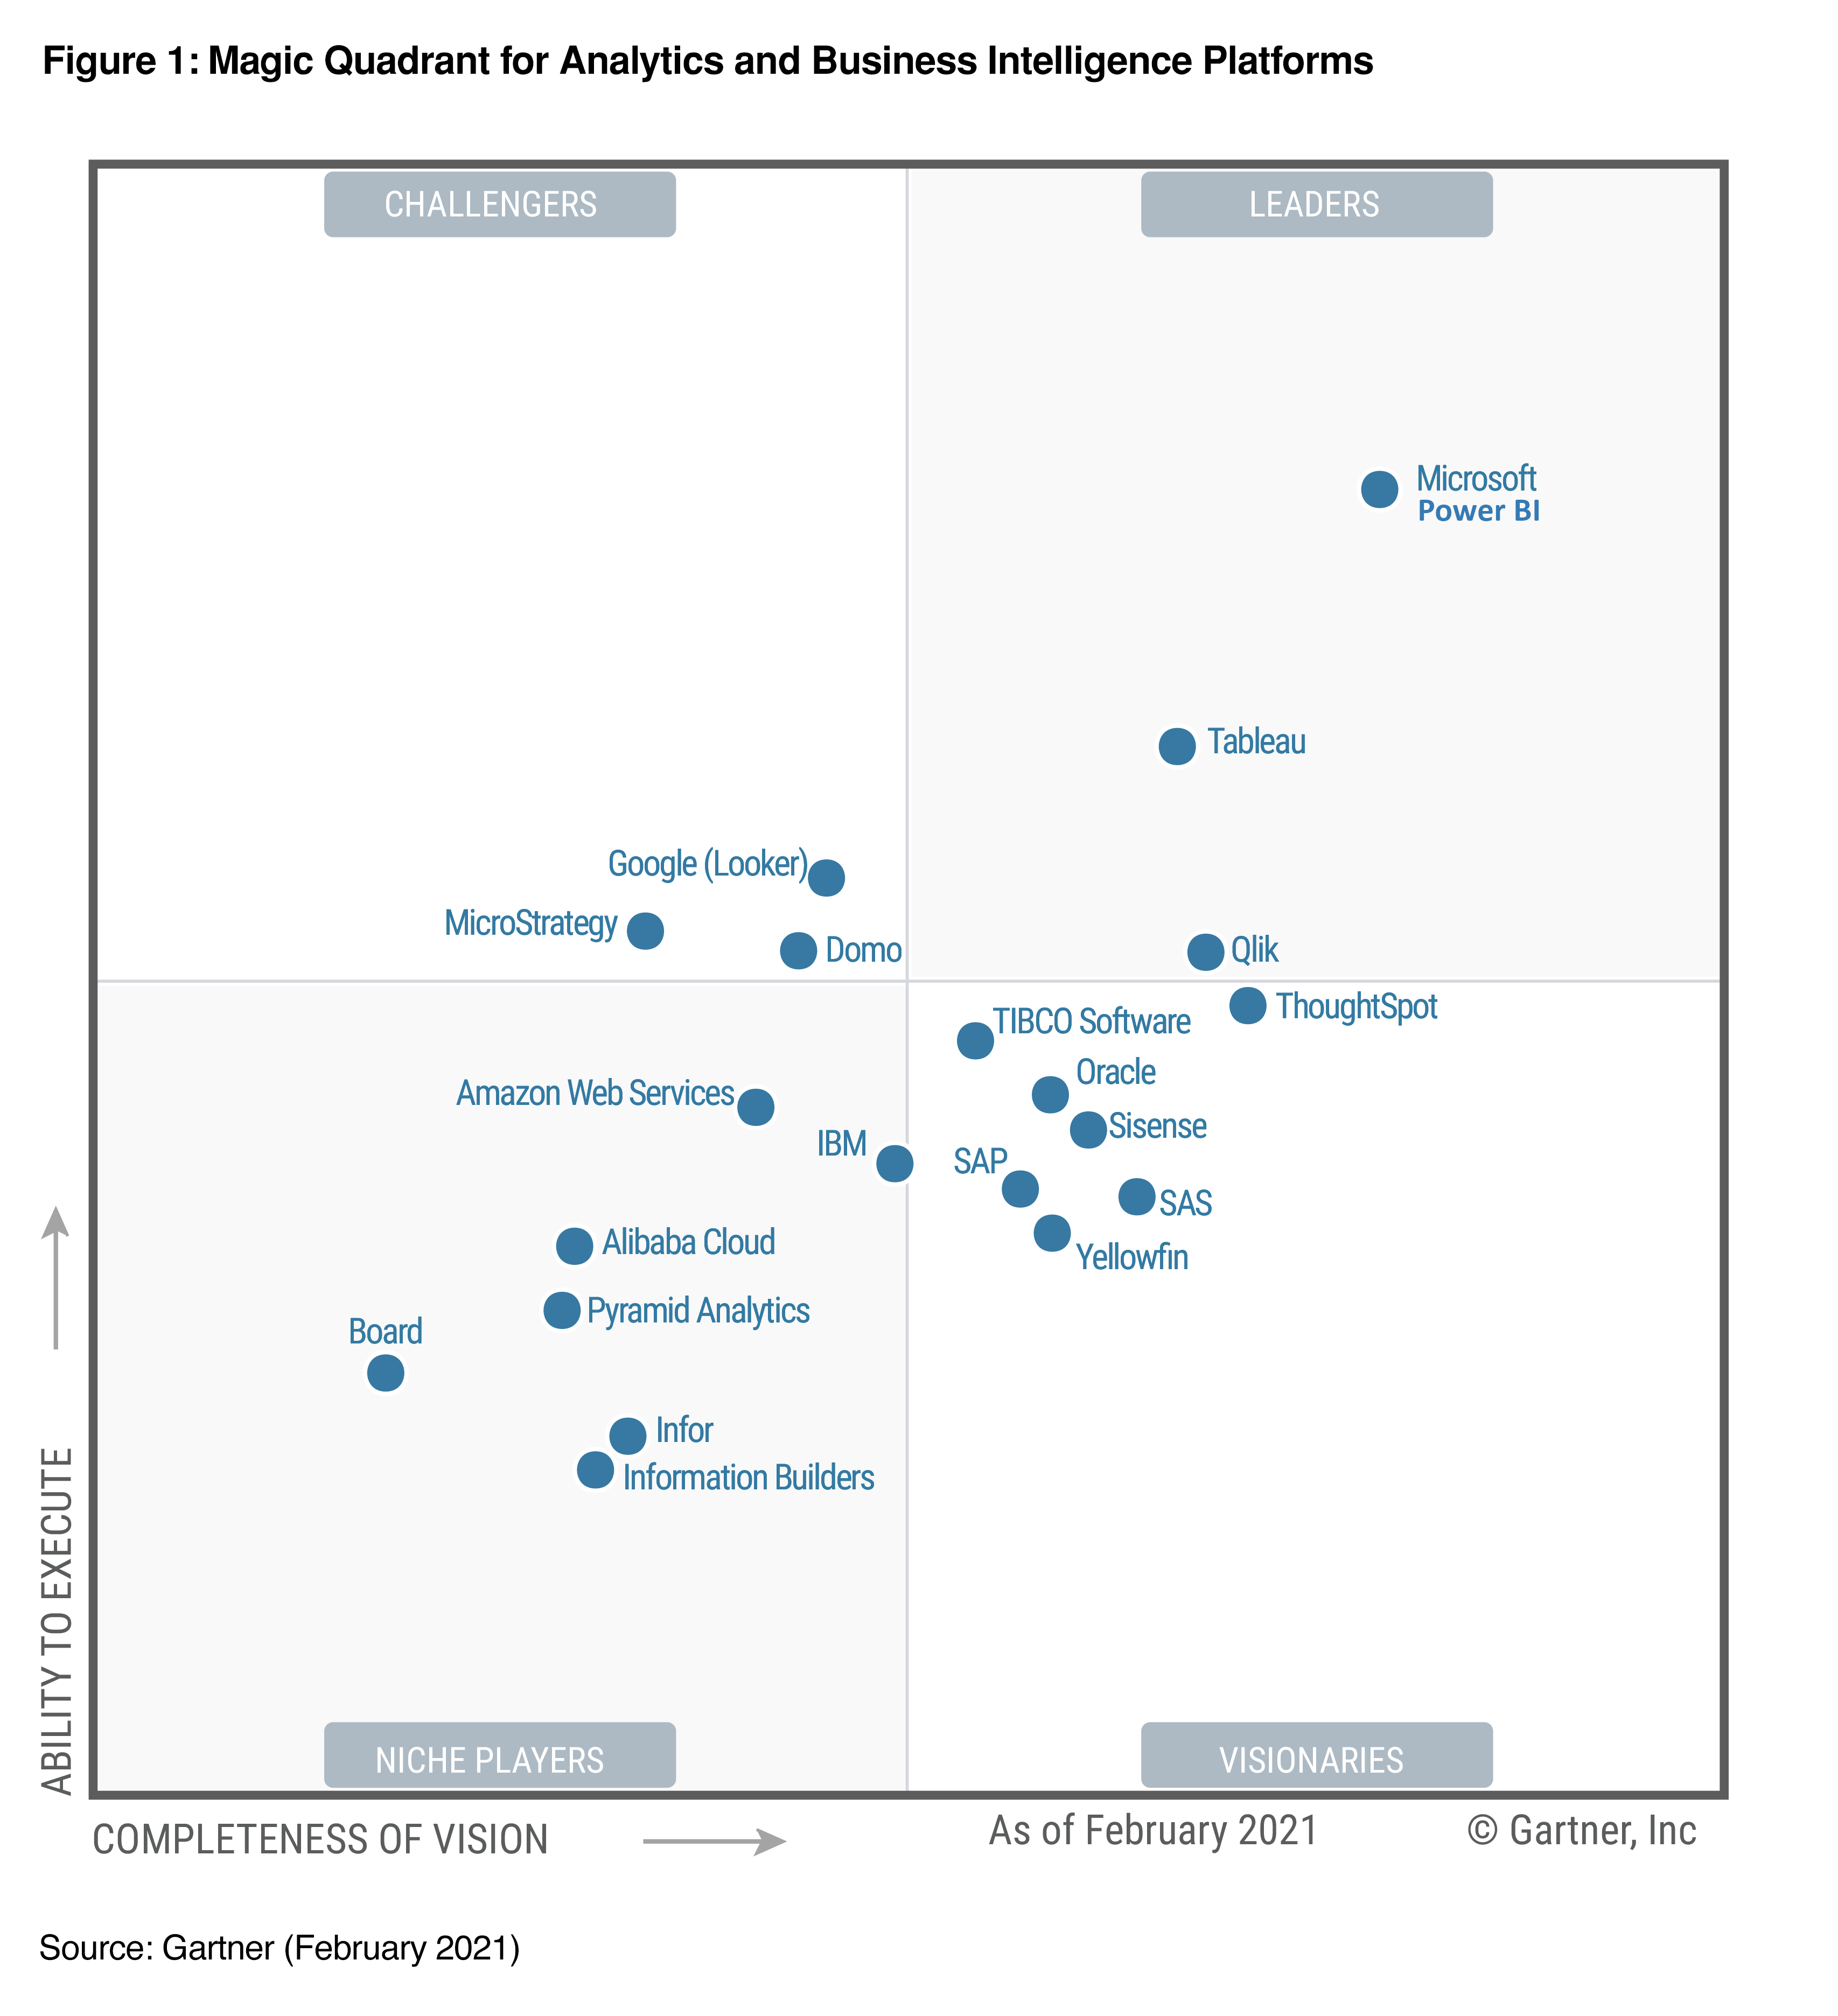
Microsoft Power BI is ranked as the best Data Analytics tool by Gartner in 2021
Certificate
Upon successful completion of each program, you’ll earn a digital certificate of completion.
0+
0/100
What will this programme do for you?
iLearn
iExplore
iAnalyse
iDesign
iAssess
iWork
After learning & practicing, it’s time now to raise you own problem and work on real projects. Mentors will work with you to apply to your business.
[pdf-embedder url=”http://titops.com/wp-content/uploads/2021/08/FILE_20210817_090548_E-Box_Deck.pdf”]
Why this programme is different?

Peer Discussion Group
Learners will have group discussion with support from mentors.

Crowdsourcing activities
You can get help from the modern phenomenon known as crowdsourcing—the practice of putting many minds to work on a single problem.

Case studies and real data sets
You learn from projects given by industry mentors and real data set fo each casestudy.

Live coding practice
You can pratice online, every time, everywhere. AI assisted platform can help you to correct your errors.

Real-world application exercises
Each concept is associated to each real world exercise. You can have critical thinking on the real problem.

Featured guest speakers
Via workshop sessions, you can learn from experienced guest speakers with real world casestudies.
Faculty

Tuong Nguyen (Ph.D.)
Lecturer @ Titops & VNU-IFI

Chieu Ta (Ph.D.)
Lecturer @ Thuy Loi University

Hoang Nguyen (MSc)
IT Expert @ National Economics University
Case studies
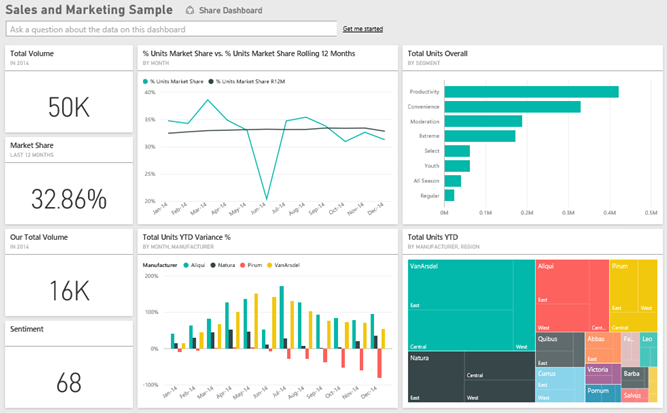
Sales & Marketing
The Sales and Marketing sample contains a dashboard and report for a fictitious manufacturing company named VanArsdel Ltd. The VanArsdel Chief Marketing Officer (CMO) created this dashboard to keep an eye on the industry and the company’s market share, product volume, sales, and sentiment.
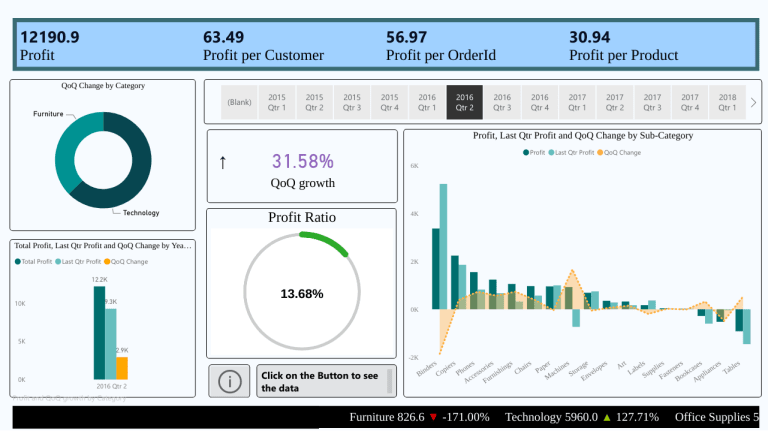
Financial Analytics
This dashboard allows one to view the revenue and profitability from different geographies, customer segments, and product segments. It allows the analysts to go deep into each of these categories and analyze the Financial Performance Indicators.
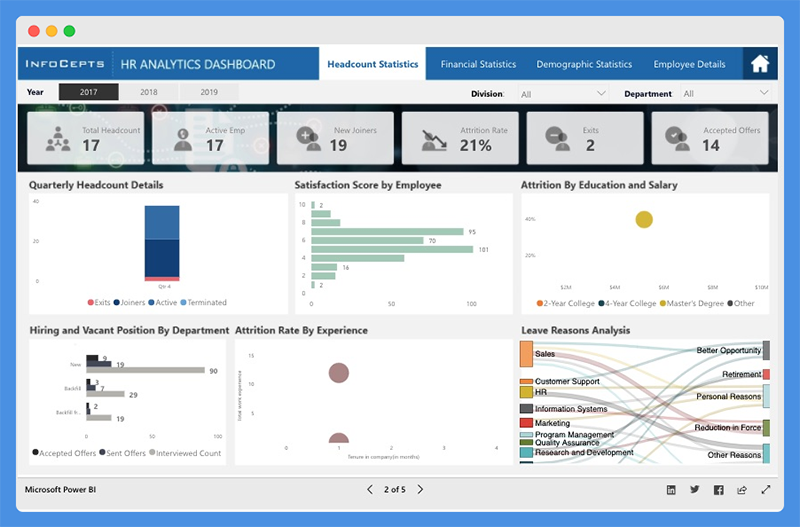
Human Resources Analytics
The HR Analytics Dashboard offers a bird’s eye view of a company’s human resource metrics including Headcount statistics, Financial statistics, Demographic statistics, Employee details.
Programme Modules
Module 1: PowerBI Fondamentals
A gentle introduction into the concepts of data analysis, the role of a Data Analyst, and the tools that are used to perform daily functions. You will gain an understanding of the data ecosystem and the fundamentals of data analysis, such as data gathering or data mining.
Learn and understand the importance of data visualization. Learn what is user experience in data visualization and its importance. Learn about basic and advance chart types used in data visualization. Learn the psychology of visualization with Gestalt Principles. Get a solid understanding of how people work in data visualization project.
Self-service business intelligence (BI) is an approach to data analytics that enables business users to access and explore data sets even if they don’t have a background in BI or related functions like data mining and statistical analysis.
Self-service business intelligence (BI) is a data analytics method that allows business users (e.g., business analysts, managers, executives) to access and explore datasets without any experience in BI, data mining, and statistical analysis. You will learn what Is Self-Service in Power BI, and others solutions like IBM, Oracle, SAP and SAS.
There has always been some sort of self-service business intelligence (BI) tools, but they were clunky and really hard for the majority of people to use. This meant that IT predominantly created all of the reports and dashboards. With a dependency on IT for reports and with high demand but few people, there was “pent-up” frustration in the business. You will learn how Microsoft Power BI can help.
Power BI designers can create official packaged content, then distribute it to a broad audience as an app. Apps are created in workspaces, where members can collaborate on Power BI content with their colleagues before publishing the finished app to individuals, large groups of people in an organization, or an entire organization.
Business analysts and BI professionals can use dataflows to handle the most complex data preparation challenges and build on each other’s work, thanks to a revolutionary model-driven calculation engine, which takes care of all the transformation and dependency logic—cutting time, cost, and expertise to a fraction of what’s traditionally been required for those tasks. Better yet, analysts can now easily create dataflows using familiar self-service tools, such as the well known Power Query data preparation experience.
Microsoft Power BI is a data visualization tool that allows you to quickly connect your data, prepare it, and model it as you like.
DAX (Data Analysis Expressions) is a formula expression language and can be used in different BI and visualization tools. DAX is also known as function language, where the full code is kept inside a function.
Module 2: PowerBI Data Visualization
Data visualization gives us a clear idea of what the information means by giving it visual context through maps or graphs. This makes the data more natural for the human mind to comprehend and therefore makes it easier to identify trends, patterns, and outliers within large data sets.
Comparision between bar charts, column charts, line charts…
Comparision between stacked chart, pie chart, waterfall chart, …
Comparision between scatter chart, Buble chart, …
Comparision between chart Data Hierarchies, Funnel Charts, Waterfall Charts, Ribbon Charts, …
The process of analyzing data in the context of geography by overlaying a map is generally known as Geospatial Analysis. Power BI is one of the tools in the Microsoft Technology stack that allows geospatial analysis using an approach that is not very technically intuitive.
This module presents the available options to filter data in Power BI by using slicers and filters. After an initial description of the features available in the Power BI infrastructure, there are several examples of the visuals available for different scenarios.
Time series forecasting is a really important area of Machine Learning as it gives you the ability to “see” ahead of time and make plans in your business accordingly. In this module, we will look at what time series forecasting is, how Power BI make time series forecasting graphs and modules that power bi uses for forecasting.
This module provides expert information for creating reports, dashboards, goals, and paginated reports.
The admin portal includes settings that govern Power BI for all users in your organization. For example, in the admin portal you can view usage metrics, access the Microsoft 365 admin center, and control how users interact with Power BI.
In this module you will learn how to connect to cloud, Power BI Mobile, Power BI Embedded
Module 3: PowerBI Final project
Learner will join industry projects and apply to their own problems using Power BI with the support from mentors.
Learner will make step-by-step tutorials as guideline for implementing Machine Learning in their own problems.
Learner will defend their internship results and get feedbacks from mentors.